
CBSE Class 10 Maths Notes - Chapter 14 Statistics
Introduction
Welcome to these comprehensive CBSE Class 10 Notes for Mathematics Chapter 14: Statistics. Statistics is the branch of mathematics that deals with the collection, presentation, analysis, and interpretation of numerical data.
Why this chapter matters:
- High Scoring: Statistics carries approximately 6-8 marks in the CBSE Class 10 Board Exam
- Real-life Applications: Used in economics, business, weather forecasting, and population studies
- Data Interpretation Skills: Essential for higher studies in economics, psychology, and data science
These CBSE Class 10 Maths Notes are 100% aligned with the latest NCERT syllabus and are perfect for board exam preparation, school exams, and competitive foundation courses.
Chapter Overview
These CBSE Class 10 Notes cover the following key topics:
- Mean of Grouped Data - Direct Method, Assumed Mean Method, Step Deviation Method
- Assumed Mean Method - Shortcut method for calculating mean
- Step Deviation Method - Simplified calculation when class intervals are equal
- Median of Grouped Data - Finding median using cumulative frequency
- Mode of Grouped Data - Finding mode using modal class formula
- Cumulative Frequency Curve (Ogive) - Less than and More than ogive types
Key Concepts (NCERT Accurate)
Mean of Grouped Data
The mean (average) of grouped data can be calculated using three methods:
Method 1: Direct Method
- fi = frequency of the ith class
- xi = class mark (mid-point) of the ith class
- Σfi = total frequency (N)
Method 2: Assumed Mean Method
- a = assumed mean (usually the middle class mark)
- di = xi - a (deviation from assumed mean)
- fi = frequency
Method 3: Step Deviation Method
- a = assumed mean
- ui = (xi - a)/h (step deviation)
- h = class size (uniform class width)
- fi = frequency
Median of Grouped Data
The median is the middle value that divides the data into two equal parts.
- l = lower limit of the median class
- N = total frequency (Σf)
- cf = cumulative frequency of the class preceding the median class
- f = frequency of the median class
- h = class width
Median Class: The class interval whose cumulative frequency is just greater than or equal to N/2.
Mode of Grouped Data
The mode is the value that appears most frequently in the data.
- l = lower limit of the modal class
- f1 = frequency of the modal class
- f0 = frequency of the class preceding the modal class
- f2 = frequency of the class succeeding the modal class
- h = class width
Modal Class: The class interval with the maximum frequency.
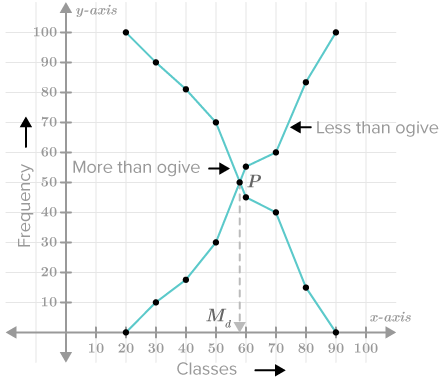
Cumulative Frequency Curve (Ogive)
An ogive is a graphical representation of cumulative frequency distribution.
- Less Than Ogive: Plot upper class limits against less than cumulative frequencies
- More Than Ogive: Plot lower class limits against more than cumulative frequencies
Finding Median from Ogive: The x-coordinate of the intersection point of less than and more than ogives gives the median. Alternatively, locate N/2 on the y-axis, draw horizontal to meet the curve, then vertical to x-axis.
Important Formulas (Quick Reference)
| Formula | Expression | When to Use |
|---|---|---|
| Mean (Direct) | Σ(fixi) / Σfi | Small data sets, simple calculations |
| Mean (Assumed) | a + (Σfidi / Σfi) | Large numbers, easier calculation |
| Mean (Step Deviation) | a + (Σfiui / Σfi) × h | Equal class intervals, large data |
| Median | l + [(N/2 − cf) / f] × h | Finding middle value, skewed data |
| Mode | l + [(f1 − f0) / (2f1 − f0 − f2)] × h | Finding most frequent value |
| Ogive | Cumulative frequency graph | Visual representation, finding median graphically |
- Use Direct Method when class marks are simple numbers
- Use Assumed Mean Method when class marks are large
- Use Step Deviation Method when class intervals are equal and numbers are very large
Solved Examples (CBSE Pattern)
Example 1: Mean by Direct Method (Easy)
Question: Find the mean of the following distribution:
| Class Interval | 0-10 | 10-20 | 20-30 | 30-40 | 40-50 |
|---|---|---|---|---|---|
| Frequency (f) | 3 | 5 | 7 | 4 | 1 |
Solution:
| Class | f | x (Mid-point) | f × x |
|---|---|---|---|
| 0-10 | 3 | 5 | 15 |
| 10-20 | 5 | 15 | 75 |
| 20-30 | 7 | 25 | 175 |
| 30-40 | 4 | 35 | 140 |
| 40-50 | 1 | 45 | 45 |
| Total | Σf = 20 | Σfx = 450 |
Formula: Mean = Σ(fx) / Σf
Mean = 450 / 20 = 22.5
Example 2: Mean by Step Deviation Method (Moderate)
Question: Calculate the mean by step deviation method:
| Class Interval | 10-20 | 20-30 | 30-40 | 40-50 | 50-60 |
|---|---|---|---|---|---|
| Frequency (f) | 5 | 8 | 12 | 10 | 5 |
Solution:
Let assumed mean (a) = 35, Class width (h) = 10
| Class | f | x | d = x-35 | u = d/10 | f × u |
|---|---|---|---|---|---|
| 10-20 | 5 | 15 | -20 | -2 | -10 |
| 20-30 | 8 | 25 | -10 | -1 | -8 |
| 30-40 | 12 | 35 | 0 | 0 | 0 |
| 40-50 | 10 | 45 | 10 | 1 | 10 |
| 50-60 | 5 | 55 | 20 | 2 | 10 |
| Total | Σf = 40 | Σfu = 2 |
Formula: Mean = a + (Σfu / Σf) × h
Mean = 35 + (2/40) × 10
Mean = 35 + 0.5
Mean = 35.5
Example 3: Median Calculation
Question: Find the median for the following data:
| Class Interval | 0-10 | 10-20 | 20-30 | 30-40 | 40-50 |
|---|---|---|---|---|---|
| Frequency (f) | 4 | 8 | 12 | 10 | 6 |
Solution:
| Class | f | Cumulative Frequency (cf) |
|---|---|---|
| 0-10 | 4 | 4 |
| 10-20 | 8 | 12 |
| 20-30 | 12 | 24 |
| 30-40 | 10 | 34 |
| 40-50 | 6 | 40 |
N = 40, N/2 = 20
Median class = 20-30 (since cf = 24 is just greater than 20)
Where: l = 20, cf = 12, f = 12, h = 10
Formula: Median = l + [(N/2 − cf) / f] × h
Median = 20 + [(20 − 12) / 12] × 10
Median = 20 + (8/12) × 10
Median = 20 + 6.67
Median = 26.67
Example 4: Mode Calculation
Question: Find the mode for the following data:
| Class Interval | 0-10 | 10-20 | 20-30 | 30-40 | 40-50 |
|---|---|---|---|---|---|
| Frequency (f) | 5 | 8 | 15 | 10 | 2 |
Solution:
Modal class = 20-30 (maximum frequency = 15)
Where: l = 20, f1 = 15, f0 = 8, f2 = 10, h = 10
Formula: Mode = l + [(f1 − f0) / (2f1 − f0 − f2)] × h
Mode = 20 + [(15 − 8) / (30 − 8 − 10)] × 10
Mode = 20 + [7 / 12] × 10
Mode = 20 + 5.83
Mode = 25.83
Example 5: Ogive-Based Question (Board Level)
Question: The following table shows the marks obtained by 100 students:
| Marks | 0-10 | 10-20 | 20-30 | 30-40 | 40-50 |
|---|---|---|---|---|---|
| Students | 10 | 15 | 25 | 30 | 20 |
Draw a less than ogive and find the median graphically.
Solution:
Less Than Cumulative Frequency Table:
| Marks Less Than | 10 | 20 | 30 | 40 | 50 |
|---|---|---|---|---|---|
| Cumulative Frequency | 10 | 25 | 50 | 80 | 100 |
Steps to Draw Ogive:
- Plot points: (10, 10), (20, 25), (30, 50), (40, 80), (50, 100)
- Join the points with a smooth curve
- Locate N/2 = 50 on y-axis
- Draw horizontal line to meet the curve at point P
- From P, draw vertical line to x-axis
- The x-coordinate gives the median
Median = 30 (approximately)

Smart Tricks for Board Exams
Quick Table Formation Trick
- Always create a neat table with proper columns
- Calculate class marks (mid-points) first: x = (Upper limit + Lower limit) / 2
- Double-check your cumulative frequency column
How to Choose Best Mean Method
- Direct Method: Use when class marks are single/double digits
- Assumed Mean Method: Use when class marks are 2-digit or more
- Step Deviation Method: Use when class intervals are equal AND numbers are large (3-digit or more)
Median Class Identification Shortcut
- Calculate N/2 first
- Scan cumulative frequency column from top
- First cf greater than or equal to N/2 indicates your median class
- Remember: Median class is NOT necessarily the middle class
Mode Identification Shortcut
- Look for the class with highest frequency
- Verify by checking neighboring frequencies
- If two classes have same highest frequency, data is bimodal (use both)
Time-Saving Board Strategy
- Write the formula clearly (carries 1/2 mark)
- Create the frequency table neatly
- Show substitution step clearly
- Box your final answer
- Keep calculator handy but verify manual calculations
Visual Learning

Figure 1: Frequency Distribution Table Example
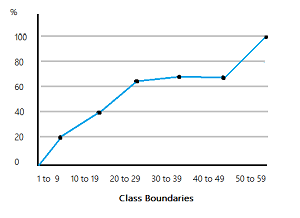
Figure 2: Less Than Ogive Graph
Figure 3: Finding Median from Intersection of Ogives

Figure 4: Mode Formula for Grouped Data
Most Important Board Questions
1 Mark Questions
- What is the formula for mean of grouped data by direct method? (1M)
- Define modal class. (1M)
- What is the median of first 5 natural numbers? (1M)
- Define cumulative frequency. (1M)
2-3 Mark Questions
- Find the mean of the following data: 2, 4, 6, 8, 10 using step deviation method. (2M)
- * Calculate the median for the distribution:
(3M)Class 0-10 10-20 20-30 30-40 f 5 10 15 10 - * Find the mode of the following data:
(3M)Class 10-20 20-30 30-40 40-50 f 4 12 8 6
4-5 Mark Questions
- ** The following distribution shows the daily pocket allowance of children:
Find the mean pocket allowance by step deviation method. (4M)Allowance (Rs.) 10-15 15-20 20-25 25-30 30-35 Children 5 10 15 8 2 - ** Find the missing frequency 'f' if the mean is 25:
(5M)Class 0-10 10-20 20-30 30-40 40-50 f 5 8 f 6 3
Case-Study Based Question
- ** Case Study: A survey was conducted to find the concentration of SO2 in the air (in ppm) in 30 localities:
(i) Find the mean concentration of SO2 (2M) (ii) Find the median concentration (2M)SO2 (ppm) 0.00-0.04 0.04-0.08 0.08-0.12 0.12-0.16 0.16-0.20 Frequency 4 9 9 2 6
- Mean calculation by all three methods
- Median from grouped data
- Mode from grouped data
- Drawing ogive and finding median graphically
- Converting frequency distribution to cumulative frequency
Common Mistakes to Avoid
| Mistake | Correction |
|---|---|
| Wrong cumulative frequency calculation | Add frequencies sequentially: cf = previous cf + current f |
| Wrong median class selection | Find N/2 first, then locate first cf greater than or equal to N/2 |
| Using wrong class limits | Use lower limit (l) in formula, not class boundaries |
| Confusing f0 and f2 in mode formula | f0 = preceding class, f2 = succeeding class |
| Forgetting to multiply by h in step deviation | Mean = a + (Σfu/Σf) × h (do not forget × h) |
| Calculation errors in fractions | Simplify step by step, use calculator for verification |
| Skipping formula writing | Always write formula first (carries marks) |
| Wrong scale selection in ogive | Choose scale that fits the graph paper properly |
Practice Section
MCQs
Q1. The abscissa of the point of intersection of the less than type and more than type cumulative frequency curves gives:
- (a) Mean
- (b) Median
- (c) Mode
- (d) Range
Q2. If the mean of a frequency distribution is 25 and Σf = 20, then Σfx is:
- (a) 500
- (b) 45
- (c) 5
- (d) 250
Q3. The class interval with maximum frequency is called:
- (a) Median class
- (b) Modal class
- (c) Mean class
- (d) Cumulative class
Assertion-Reason
Q4.
Assertion (A): The mode is always unique for any given data.
Reason (R): Mode is the value that appears most frequently in the data.
Choose the correct option:
- (a) Both A and R are true and R is the correct explanation of A
- (b) Both A and R are true but R is not the correct explanation of A
- (c) A is true but R is false
- (d) A is false but R is true
Case-Study Based
Q5. Case Study: The following data shows the literacy rate (in %) of 35 cities:
| Literacy Rate (%) | 40-50 | 50-60 | 60-70 | 70-80 | 80-90 |
|---|---|---|---|---|---|
| Number of Cities | 3 | 8 | 12 | 8 | 4 |
(i) Find the mean literacy rate (2M)
(ii) Find the modal literacy rate (2M)
HOTS Questions
Q6. If the mean of the following distribution is 27, find the value of p:
| Class | 0-10 | 10-20 | 20-30 | 30-40 | 40-50 |
|---|---|---|---|---|---|
| f | 8 | p | 12 | 13 | 10 |
Q7. Draw both less than and more than ogives for the following data and hence find the median:
| Marks | 0-10 | 10-20 | 20-30 | 30-40 | 40-50 |
|---|---|---|---|---|---|
| Students | 5 | 8 | 12 | 10 | 5 |
Frequently Asked Questions (FAQ)
Is Statistics important for CBSE Class 10 board exam?
Yes, very important! Statistics carries 6-8 marks in the CBSE Class 10 Board Exam. It is one of the most scoring chapters in CBSE Class 10 Maths Notes because questions are formula-based and predictable. Regular practice can help you score full marks in this chapter.
Which mean method is easiest in board exam?
The Step Deviation Method is easiest when class intervals are equal and numbers are large. However, if class intervals are not equal or numbers are small, use the Direct Method. The Assumed Mean Method is best for moderate-sized numbers. These CBSE Class 10 Notes recommend choosing based on the data given in the question.
Are these CBSE Class 10 Maths Notes based on NCERT?
Yes, 100%! These CBSE Class 10 Notes are completely aligned with the latest NCERT textbook for Class 10 Mathematics. All formulas, examples, and concepts strictly follow the NCERT pattern and are verified by experienced mathematics teachers.
What is the difference between ogive and frequency polygon?
An ogive represents cumulative frequencies and is used to find median graphically. A frequency polygon represents actual frequencies and is drawn by joining mid-points of class intervals. CBSE Class 10 Notes focus on ogives as they are more commonly asked in board exams.
How to identify the median class quickly?
Calculate N/2 first. Then scan the cumulative frequency column from the top. The first class whose cumulative frequency is greater than or equal to N/2 is your median class. This shortcut is emphasized in these CBSE Class 10 Maths Notes for quick identification.
Conclusion
Mastering Statistics requires understanding of formulas and systematic calculation. These CBSE Class 10 Maths Notes provide you with comprehensive coverage of all concepts - from basic mean calculations to complex ogive constructions.
- Memorize all five formulas (3 for mean, 1 for median, 1 for mode)
- Practice creating frequency tables quickly and accurately
- Solve previous year board questions (last 5 years)
- Draw ogives neatly with proper scale and labeling
- Double-check cumulative frequency calculations
Next Chapter: Continue your preparation with Probability - CBSE Class 10 Notes for complete coverage of the remaining syllabus.
Keywords: CBSE Class 10 Notes, CBSE Class 10 Maths Notes, Class 10 Maths Chapter 14 Notes, Statistics Class 10 Notes, Mean Median Mode Class 10, NCERT Class 10 Maths Notes, Class 10 Maths Notes PDF
